AP3’s environmental impact
Respect for the environment is at the centre of the AP3 investment approach. The Fund’s direct environmental impact is relatively small, consisting primarily of business travel, use of energy for office heating and cooling, and waste. Since 2017 the Fund has decreased its direct environmental impact in several ways, of which can be mentioned a decreased energy use of 41 % and a decreased CO2 emission from business trips of 26 %.

Business travel
For business trips within Sweden, AP3 staff try where possible to use the train rather than travel by air. However, most business travel is to foreign destinations and involves flying. We routinely and more often use phone and video conferencing as an alternative to business travel. Our head office location in central Stockholm is conducive to efficient travel by public transport or bicycle rather than by car. AP3 has no company cars.
Energy-efficient office
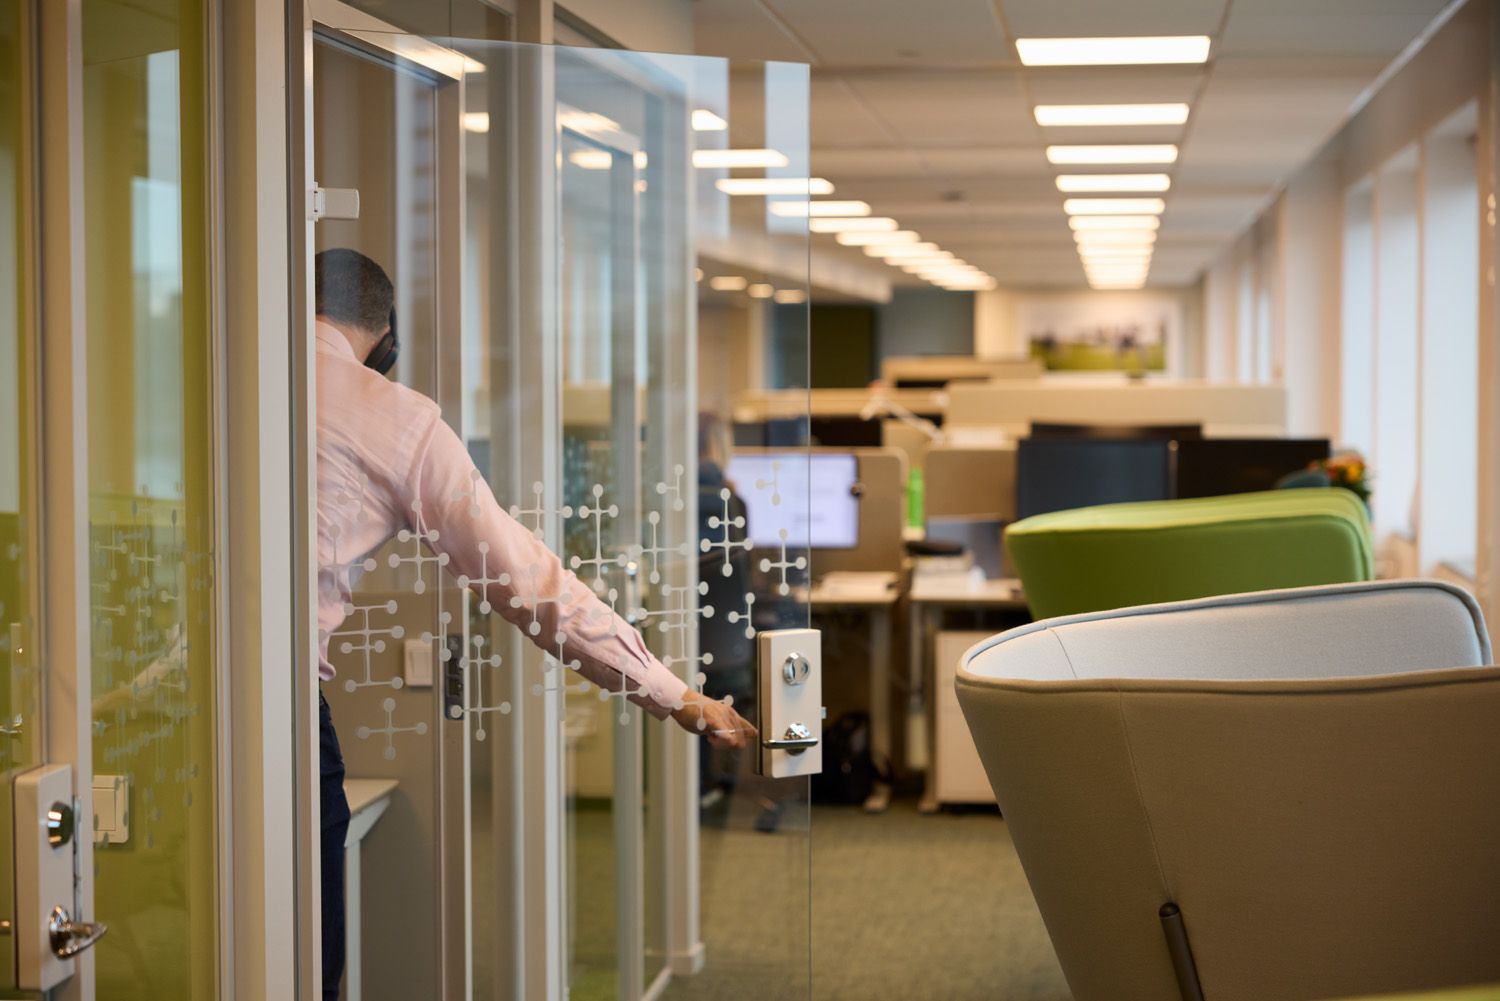
Our office premises have LEED Platinum certification. LEED is one of the world’s leading environmental rating systems for buildings. Certification covers aspects such as energy use, indoor climate and use of recycled and locally produced materials. AP3 recycles paper and electronic waste and sorts carton, metal, plastic, batteries, light bulbs and kitchen waste.
Organisation´s energy use | 2024 | 2023 | 2022 | 2021 | 2020 | 2019 |
|---|---|---|---|---|---|---|
Energy use, total kwh | 70 965 | 69,020 | 69,027 | 84,028 | 94,140 | 134,904 |
- electricity, kwh | 53 968 | 49,980 | 41,139 | 41,692 | 50,460 | 90,140 |
- heating, kwh | 16 997 | 19,040 | 27,888 | 42,336 | 39,200 | 39,200 |
Direct greenhouse gas emissions | ||||||
Business travel, CO2 tonnes | 219.2 | 256.7 | 123.6 | 37.9 | 47.9 | 118.8 |
Courier journeys, no. | 48 | 95 | 79 | 34 | 137 | 145 |
- cycle courier journeys in Stockholm, no. | 19 | 22 | 15 | 13 | 68 | 96 |
- car hybrid journeys in Stockholm, no. | 15 | 48 | 49 | 10 | 40 | 49 |
- courier journeys outside of Stockholm | 0 | 0 | 0 | 2 | 2 | 1 |
- domestic and foreign couriers by air | 10 | 16 | 14 | 9 | 27 | 49 |
Total weight of waste | ||||||
Paper use, kg | 137.5 | 251 | 178 | 469.4 | 475.6 | 865.5 |
Ecolabel paper as percentage of total paper use, % | 100 | 100 | 100 | 100 | 100 | 100 |
Recycled paper waste, kg | 570 | 725 | 844 | 698 | 740 | 1,555 |
Recycled electronic waste, kg | 65 | 15 | 530 | 0 | 0 | 264 |


